Observability Verification
This page maps metrics to the quality-attribute scenarios, records dashboard capture metadata and explains how to reach the local dashboards. Metric design and known instrumentation gaps remain in Observability; service-level targets remain in SLOs & SLIs.
QAS-1: scan performance
packytrace_scan_duration_seconds measures the full scan use case and packytrace_passport_section_duration_seconds{section} shows which optional section consumed the time. The resulting ratio is defined in SLO-1. To exercise the scenario, run make up, drive scans through the gateway and read the section-latency panel.
QAS-2: external-source degradation
packytrace_external_source_requests_total{source,outcome} records source failures and packytrace_circuit_breaker_open{source="openfoodfacts"} exposes breaker state. Scan outcomes and section metrics show whether Passport kept serving useful data. A controlled failing endpoint can exercise this path without depending on an external outage.
QAS-3: consent-revocation erasure
erasure_propagation_total{outcome} counts consumer-side ConsentRevoked health-profile erasures by result. It is incremented at the erasure dispatch point, so it counts attempted profile erasures rather than every identity fact.
Open gap. The Personalization consumer is best-effort, with no retry or escalation; reliable retries and a complete AccountDeleted flow are not implemented. The metric makes failure visible, but there is no alerting action yet. See Exception Tracking.
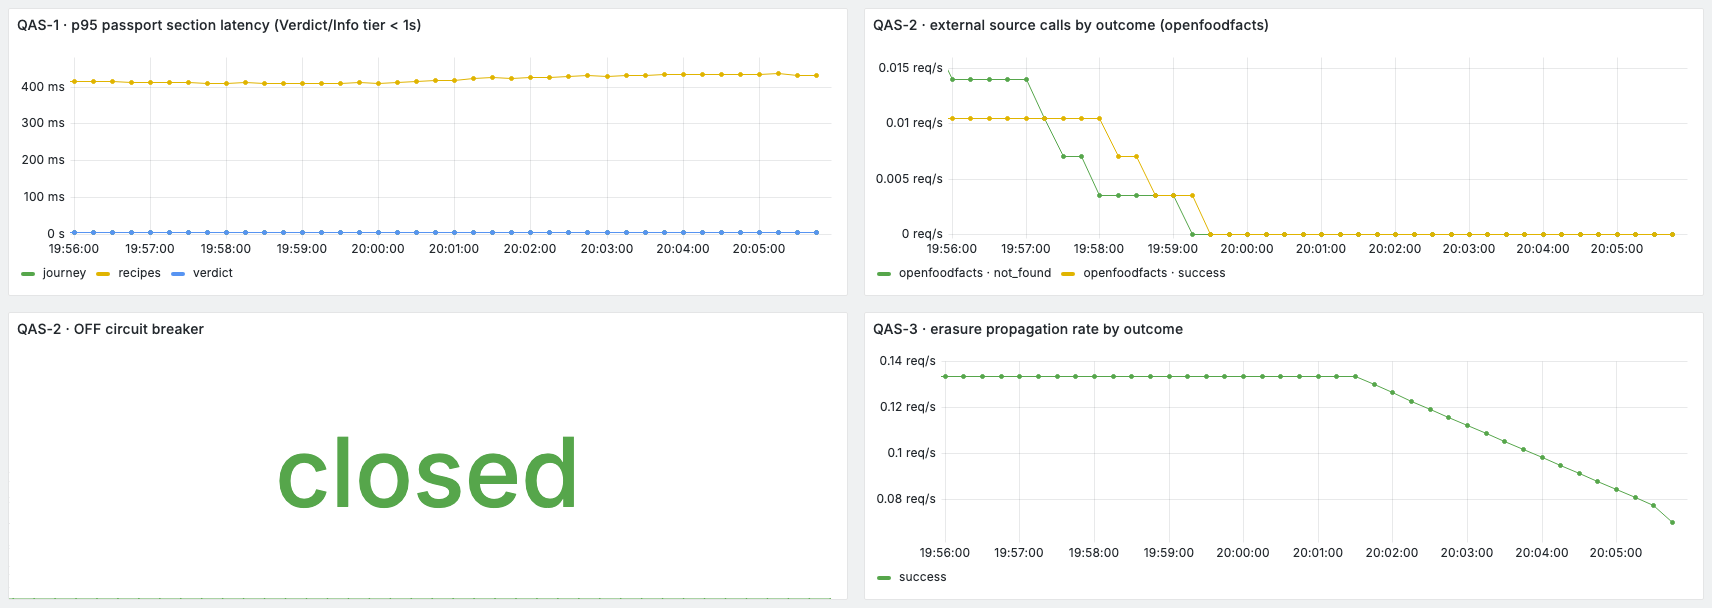
Capture metadata: 2026-07-31; local Compose; synthetic demo traffic; ten-minute data window; the working-tree commit was not recorded. This is a dashboard-layout example, not release evidence. QAS-2 is non-empty because some scans requested products absent from the local catalog. QAS-3 is non-empty because the same run exercised authenticated consent revocation.
Dashboard layout
Grafana auto-provisions its Prometheus datasource and the PackyTrace SLOs & QAS dashboard from deployment/grafana/dashboards/packytrace-slo.json.
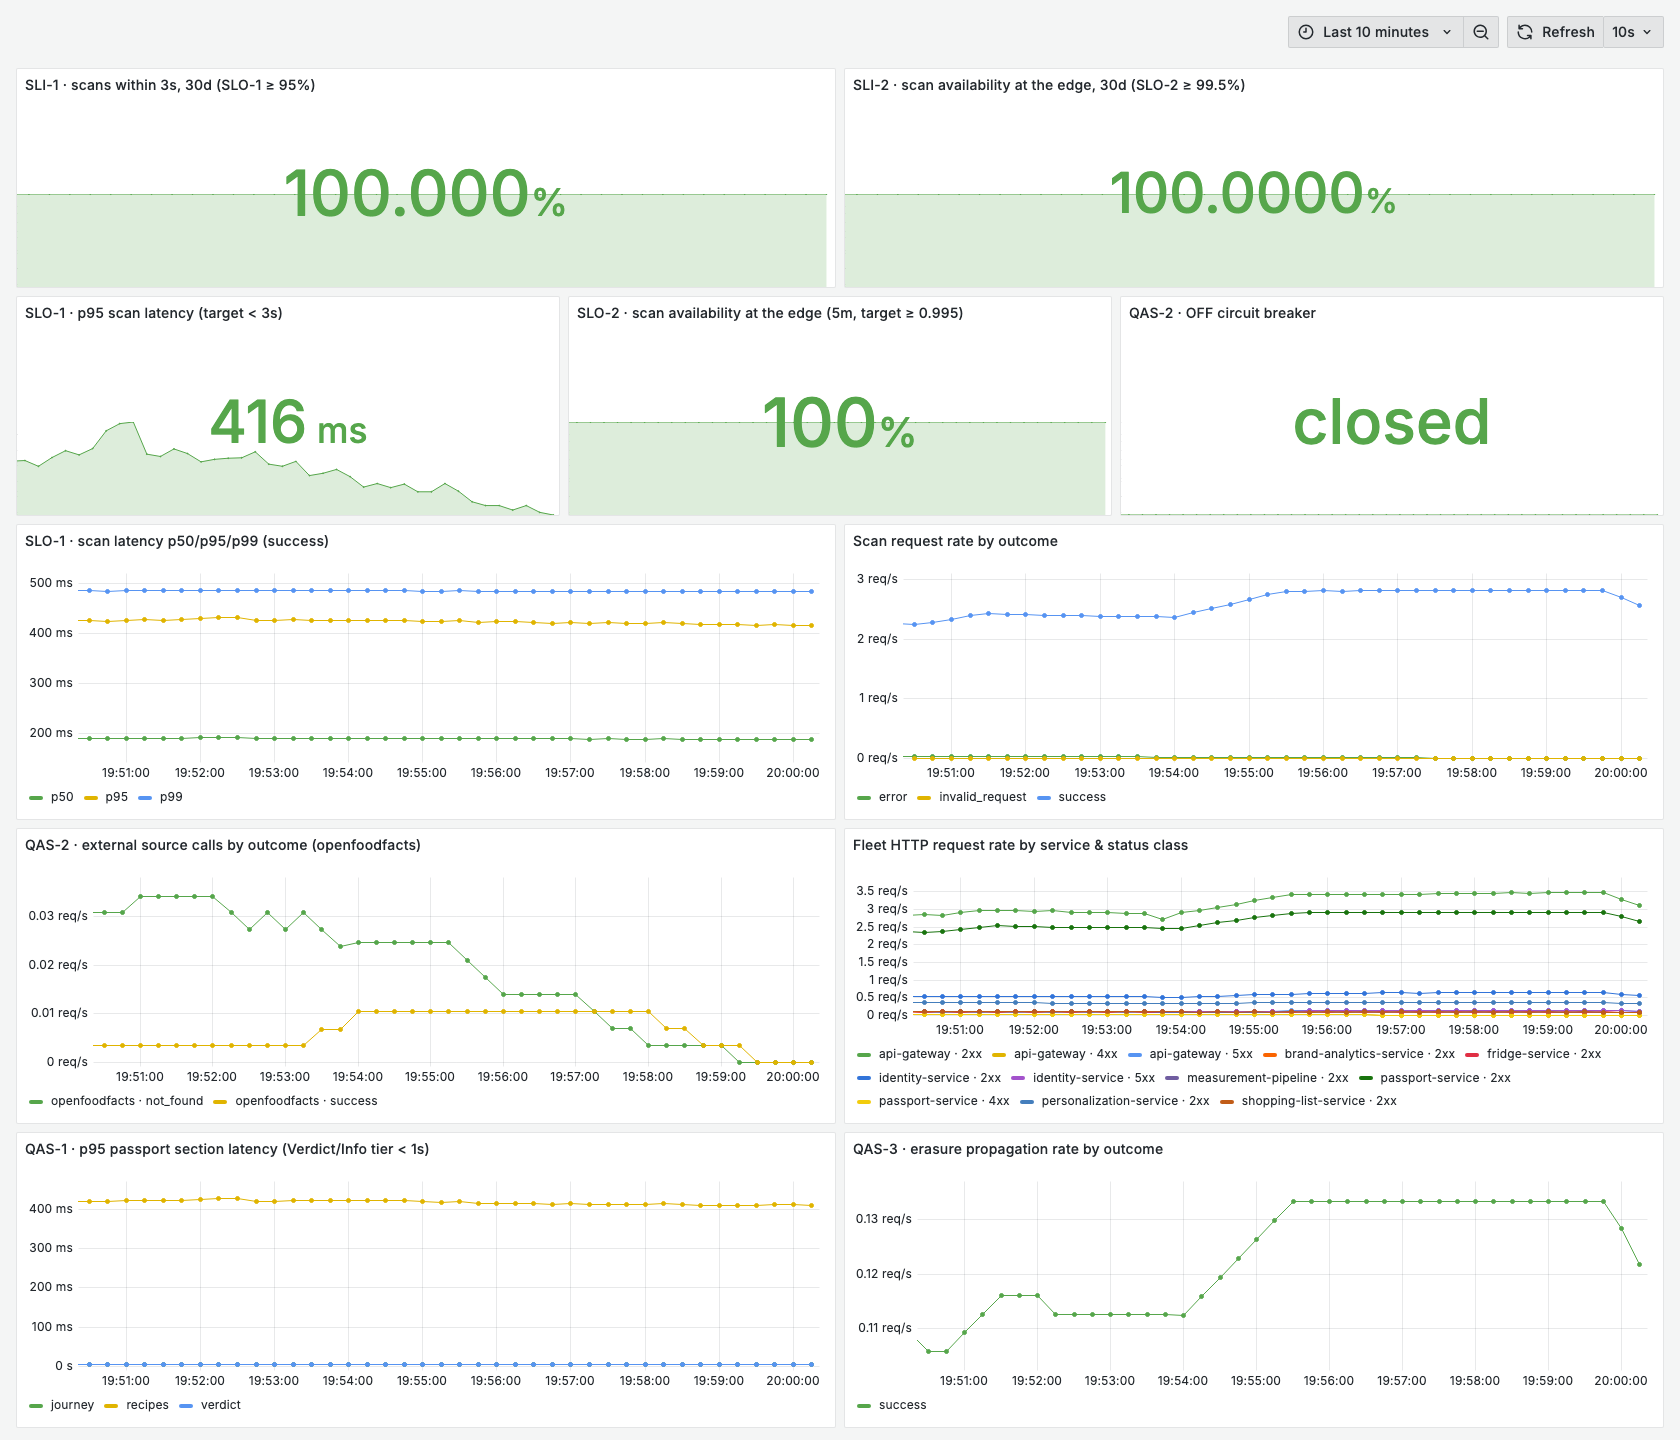
Capture metadata: 2026-07-31; local Compose (make up); synthetic demo scans; less than one day of retained data; the working-tree commit was not recorded. Panels whose queries say “30 days” therefore show only that shorter available history.
The target definitions and interpretation of the service-level panels are in SLOs & SLIs. The remaining panels cover section latency (QAS-1), external-source calls and breaker state (QAS-2), erasure propagation (QAS-3), scan outcomes and fleet HTTP rate by service and status class.
Access
Local development
Prometheus (:9090) and Grafana (:3000) run in deployment/docker-compose.yml:
make up
# Grafana:    http://localhost:3000   (anonymous viewing on, no login)
# Prometheus: http://localhost:9090   (Status -> Targets to confirm scrapes)
Metrics appear after traffic flows. Drive scans through POST http://localhost:8080/api/v1/scans and wait one scrape interval.
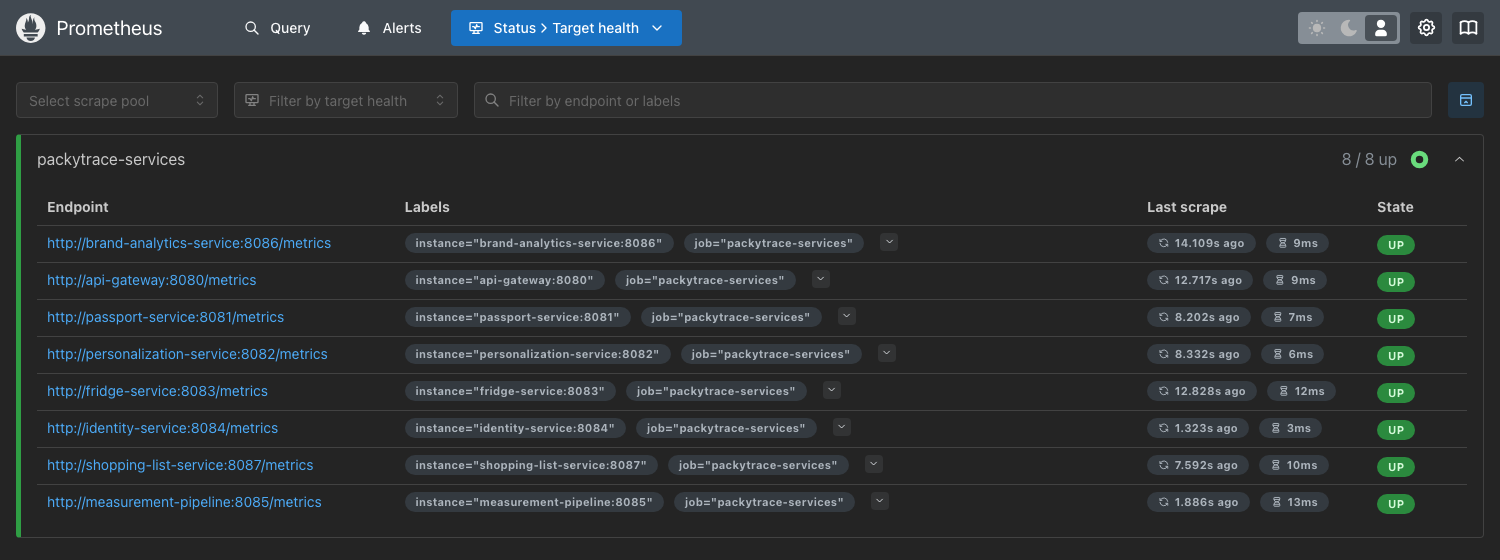
Capture metadata: 2026-07-31; local Compose; working-tree commit not recorded. This proves that the configured targets were reachable at capture time, not that the services remained healthy.
AWS demonstration deployment
The AWS deployment exposes Grafana and Prometheus through authenticated Caddy subdomains rather than host ports. Credential retrieval, DNS, configuration rollout and access commands have one owner: AWS observability dashboards.