Service Level Objectives
PackyTrace currently measures two service-level objectives for the scan API. Both cover POST /api/v1/scans; they do not yet cover the native-camera GS1 resolver route and its redirect. QAS-1 requires the complete public journey, so resolver instrumentation remains a known gap.
An SLO states the level of service the team aims to provide. An SLI is the number used to check whether that target is being met. These are internal engineering goals, not contractual promises to customers.
Both objectives use a rolling 30-day window. Prometheus calculates the SLIs from live traffic using the recording rules in deployment/prometheus/rules/slo.yml, and Grafana shows the results at the top of the PackyTrace SLOs & QAS dashboard. How that dashboard is provisioned and reached is covered in Observability Verification; this page defines the targets themselves.
SLO-1: scan latency
Over any rolling 30-day period, at least 95% of successful scans should return a product passport, with all available sections, within 3 seconds.
This target comes from QAS-1. It covers synchronous passport resolution after the scan API request reaches Passport Service. Timing only one database query or external API call would miss delays elsewhere in the journey.
What we measure (SLI-1)
The latency SLI is:
successful scans completed within 3 seconds / all successful scans
Prometheus calculates it with:
# Recorded as slo:scan_latency:ratio_rate5m
sum(rate(packytrace_scan_duration_seconds_bucket{outcome="success", le="3.0"}[5m]))
/
(sum(rate(packytrace_scan_duration_seconds_count{outcome="success"}[5m])) > 0)
The source metric is packytrace_scan_duration_seconds, emitted by passport-service. Its histogram includes a bucket at exactly 3 seconds, so the SLI counts requests on either side of the target instead of estimating a percentile. The recording-rule file documents the Prometheus bucket label used by the current runtime. Grafana also shows p50, p95 and p99 latency for diagnosis.
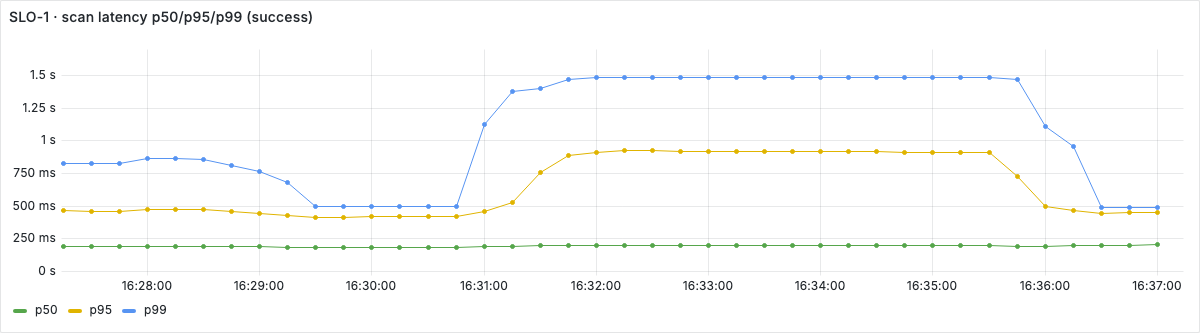
Capture metadata: 2026-08-01; local Compose; synthetic demo scans; ten-minute query and retained data window; working-tree commit not recorded. The image illustrates interpretation only.
The three series answer different questions. p50 barely moves here, so the typical scan is unaffected; p95 and p99 rise and fall together, which is a slow tail rather than the whole distribution shifting. A breach with p50 moving as well would point at the scan path itself instead of a few slow sources.
The remaining 5% is the latency error budget. If more than 5% of successful scans take longer than 3 seconds, the team should pause risky changes on the scan path and work on the cause of the slowdown.
SLO-2: scan availability
Over any rolling 30-day period, at least 99.5% of scan requests should receive a response from the public API without a server error.
What we measure (SLI-2)
The availability SLI is:
scan requests that return a non-5xx response / all scan requests
Prometheus calculates it with:
# Recorded as slo:scan_availability:ratio_rate5m
sum(rate(http_requests_total{service="api-gateway", route=~"/api/v1/scans.*", status_class!="5xx"}[5m]))
/
(sum(rate(http_requests_total{service="api-gateway", route=~"/api/v1/scans.*"}[5m])) > 0)
The source is the shared http_requests_total metric, filtered to scan requests at the API gateway. Measuring at the public edge matters: if passport-service is down, it cannot report its own failure, but the gateway still records the resulting 5xx response. This keeps the measurement close to what the consumer actually experiences.
A 4xx response counts as protocol availability because the service handled the request and returned its documented client response; for example, an unknown product can return 404. This SLI does not measure whether the response contains a known product or useful content. A 5xx response counts against the SLO because the platform failed to complete the request.
The 0.5% error budget is request-based: at most 5 of every 1,000 requests may return 5xx over the window. It must not be converted to downtime without a separate time-based SLI and traffic-shape assumption. If the budget is used up, reliability work on the scan path takes priority over risky changes to that path.
How to read the recorded SLIs
Prometheus records a short view for day-to-day diagnosis and a 30-day view for the SLO:
| Recorded series | What it tells us |
|---|---|
| slo:scan_latency:ratio_rate5m | Share of successful scans completed within 3 seconds during the recent 5-minute window |
| slo:scan_availability:ratio_rate5m | Share of recent scan requests answered without a 5xx response |
| slo:scan_latency:ratio_30d | Rolling 30-day latency result; the target is at least 0.95 |
| slo:scan_availability:ratio_30d | Rolling 30-day availability result; the target is at least 0.995 |
The two views use different calculations. The 5-minute ratios come from rate() over the recent window and answer "how are we doing right now". The 30-day values read the raw counters over the whole window with increase(), for example:
# Recorded as slo:scan_availability:ratio_30d
sum(increase(http_requests_total{service="api-gateway", route=~"/api/v1/scans.*", status_class!="5xx"}[30d]))
/
(sum(increase(http_requests_total{service="api-gateway", route=~"/api/v1/scans.*"}[30d])) > 0)
Reading the counters directly weights every request equally, which is what an error budget expressed in requests requires. Averaging the 5-minute ratios instead would weight each time window equally, so a quiet night would count as much as a busy afternoon.
Every ratio guards its denominator with '> 0'. Without the guard, a window with no scan traffic evaluates as 0/0, records NaN, and a single NaN sample makes any aggregate over it NaN as well. With the guard, an idle window simply records no sample.
Retention requirement
Both objectives require Prometheus to retain and persist at least 30 days of raw counter history. Without that history, the 30-day panels show only the available subset and are not representative.
Where the SLOs appear
Both objectives are read from the PackyTrace SLOs & QAS dashboard, which Grafana provisions from disk; Observability Verification covers how it is provisioned and reached.
The top row is the verdict: the two 30-day SLI results computed by the recording rules, SLI-1 against the 95% target and SLI-2 against 99.5%. Below them, p95 scan latency against the 3-second target and scan availability at the edge over 5 minutes give the current picture rather than the rolling one.
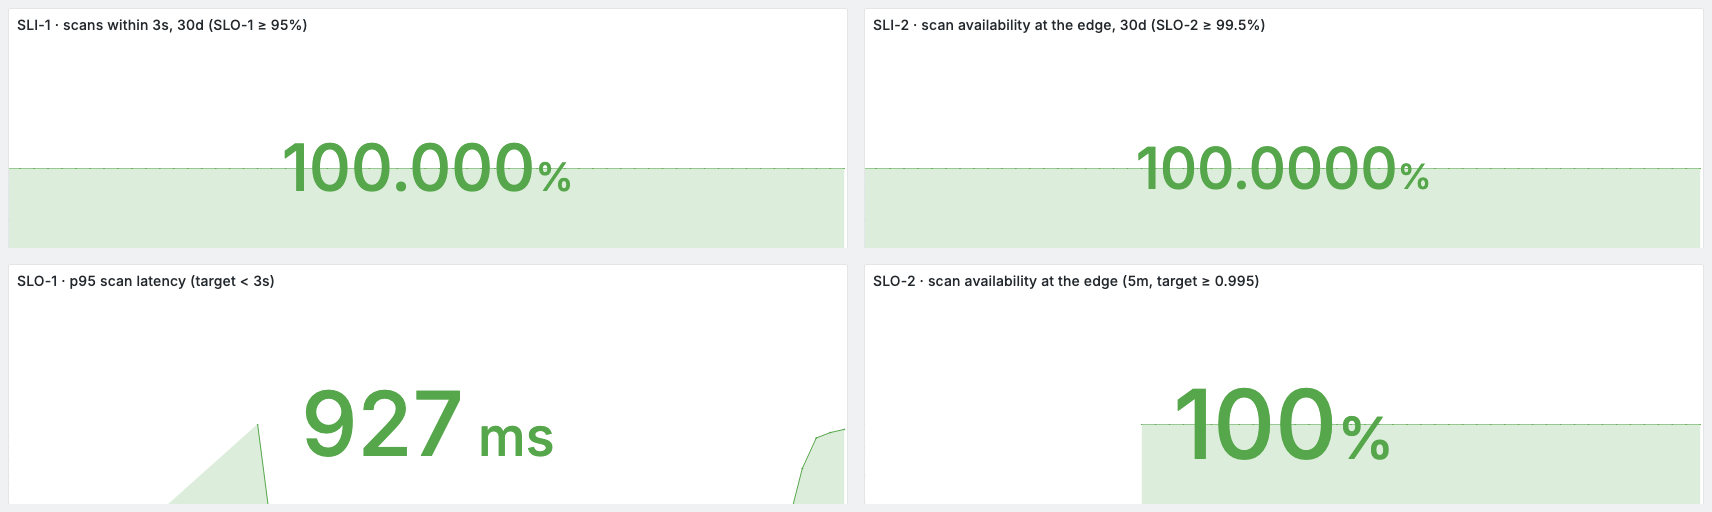
Capture metadata: 2026-08-01; short-lived local Compose stack; synthetic demo scans; less than one day of retained data; working-tree commit not recorded. It was not captured from 30 days of traffic. It demonstrates panel rendering and thresholds, not SLO compliance. A panel turns red when it crosses its threshold.
To check them locally, run make up, send a few scans through the gateway and open the dashboard at http://localhost:3000. The 5-minute values appear first. The rolling values become representative only after enough history has been collected.